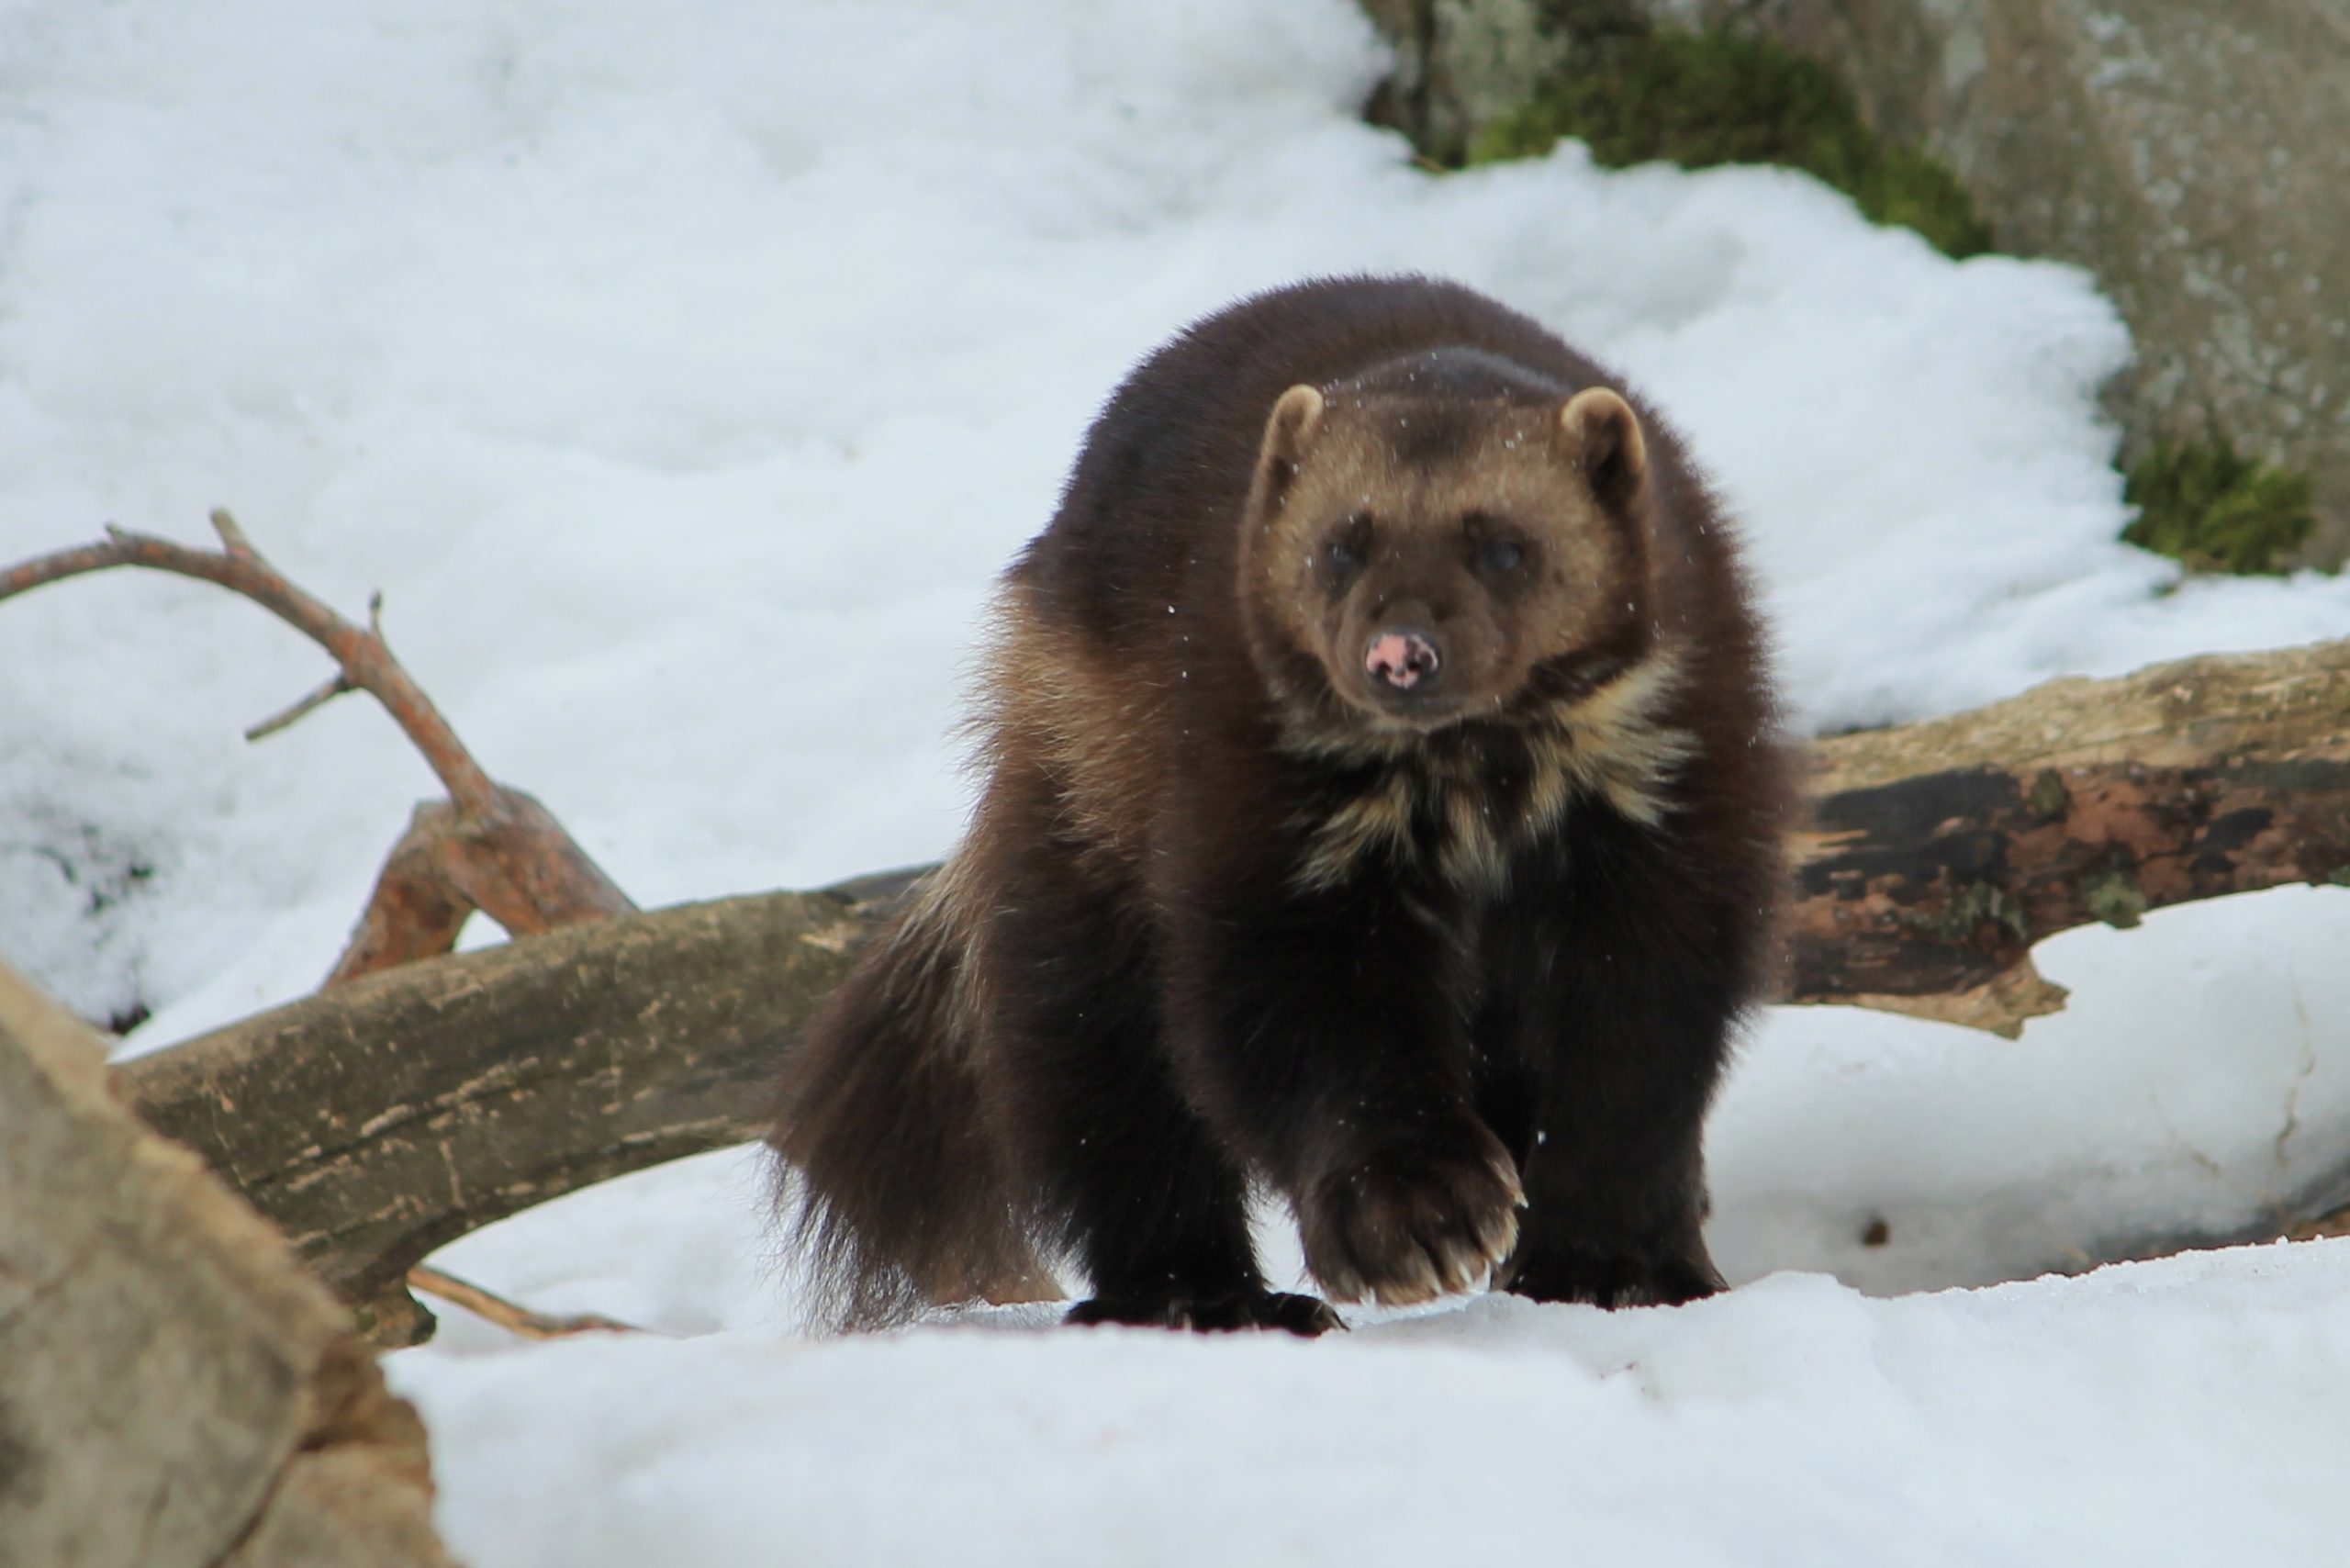
The wolverine (Gulo gulo, not the Marvel hero) is the largest terrestrial member of the weasel family. In the early 20th century, wolverines were nearly extirpated in the contiguous United States, but still had populations in Canada. However, since their populations are so low in the US, they have become a conservation concern.
Previous studies on wolverines have found that there is lower genetic diversity and higher genetic differentiation in the US populations compared to Canadian populations (Kyle & Strobeck 2001, 2002; Cegelski et al 2003, 2006; Schwartz et al. 2007; McKelvey et al. 2011). Interestingly, wolverines are able to travel long distances (15 miles in a day!), so their high dispersal would suggest that they would have a more panmictic population. Because of this discrepancy, landscape genetic studies can tease apart the effect of the landscape on the genetic connectivity between populations. The classic isolation-by-distance (IBD, Wright 1943) model posits that genetic distances increase with increasing geographic distance, however this assumes that the landscape is homogeneous. Therefore, isolation-by-resistance (IBR, McRae 2006) has become the go-to model for landscape genetic studies. To test IBR, modeling map connectivity, Circuitscape was born (McRae et al 2007) and the wolverine was the first test subject for this program (McRae & Beier 2007). This early study found that the range map for wolverines better predicted genetic connectivity than distance alone.
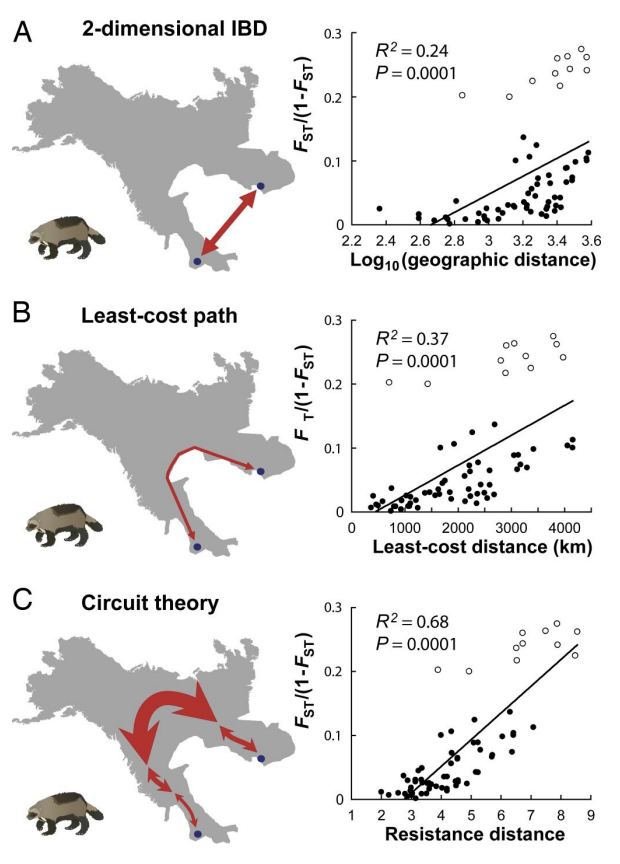
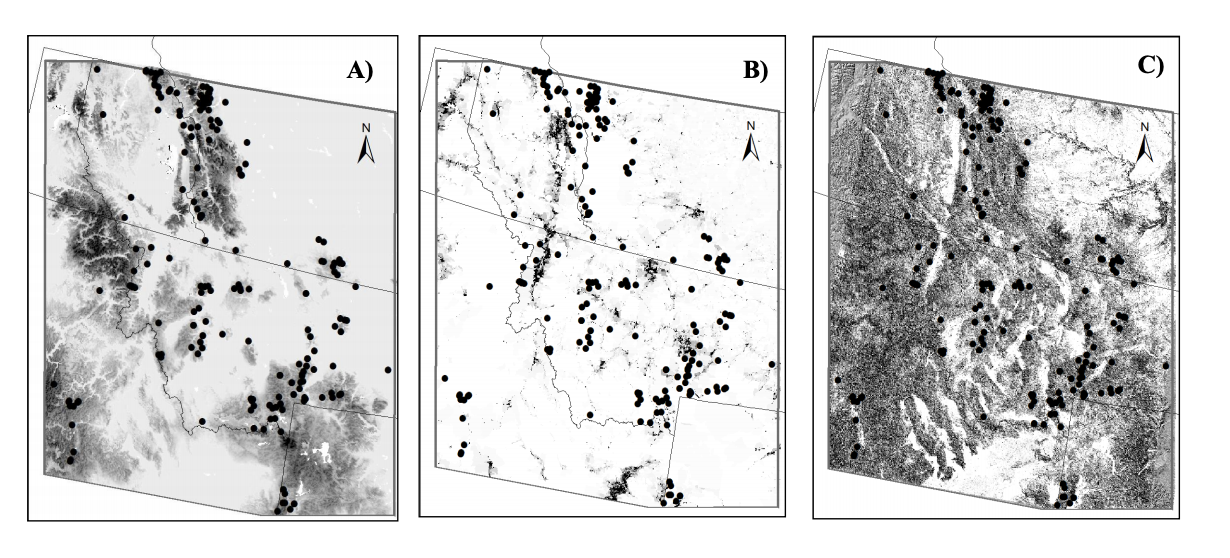
Although the range map was a great predictor of genetic connectivity, there are a number of landscape variables that can also influence dispersal in wolverines, which might be important for detailing where to manage conserved populations. Thus, Balkenhol et al. (2020) sought to identify these landscape variables. Researchers used previously analyzed genetic data from Schwartz et al. (2009) and eight landscape layers of variables that include snow depth, two elevation difference metrics, terrain ruggedness index, housing density, human population density, road density, forest edge habitat, and conifer cover. Similar to results found by McRae and Beier (2007), IBR was a better predictor of gene flow than IBD. Snow cover was the best predictor for gene flow in both fine- and broad-scale analyses. At a fine spatial scale, conifer cover, forest edge habitat, elevation, and road density had significant, but weak relationships with genetic distance. At a broad spatial scale, housing density and terrain ruggedness had strong, significant relationships with genetic distance.
Although snow cover is the best predictor of gene flow, there does appear to be a negative effect of anthropogenic disturbance on gene flow for wolverines. Even though housing development is not where the wolverines are living, they typically live in snow covered dens, these areas are likely acting as a barrier to dispersal. In order to better protect wolverines, it is crucial that we find optimal corridors to maintain movement among wolverine habitats.
Leave a Reply