
Urbanization is rapidly transforming the Earth leading to drastic changes in the local ecological communities and changing the evolutionary dynamics of organisms living within cities. Previous research has shown that urbanization can prohibit, facilitate, or have little effect on gene flow but the scale at which these phenomena occur are highly dependent on the organism, their dispersal ability, and their relationship with humans. Pigeons, Columba livia, are common in cities around the world, have high dispersal ability, and are considered a human commensal: an organism in which one species benefits (in this case, pigeons) while the other organism is unharmed (people). This led me to ask: how does urbanization in the Northeastern USA shape the population genetics of pigeons?
Study Location & Methods
The Northeastern USA is also known as the Bos-Wash corridor or the Northeastern Megacity, and conveniently my home base (New York City) is located in the middle of this region. The Northeastern Megacity encompasses six major cities (Boston, Providence, New York City, Philidelphia, Baltimore, & Washington DC) connected by suburban hamlets and towns covering ~750km and containing approximately 17% of the USA population (~50 million people) making it the most densely populated region in the United States. Through a series of road trips across the Northeast, and with help from lots of friends and a net gun, I collected blood samples from 473 pigeons throughout the Northeast. Back in the lab, I used ddRAD sequencing to examine a reduced representation of genome-wide SNPs (single nucleotide polymorphisms).
Pigeons form Two Genetic Clusters in the Northeastern USA
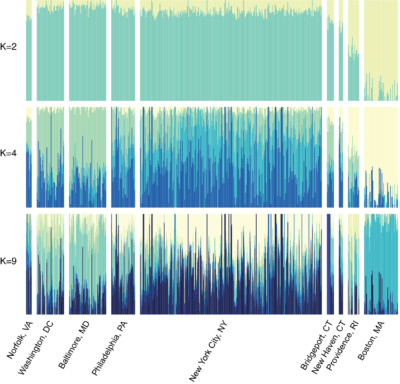
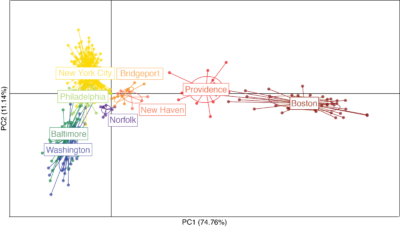
While I had predicted that pigeons in each city would form a genetic cluster (because why leave when you have plenty of shelters, food, and mates?) and because previous research had shown that pigeons in Europe and Singapore tend to stick to the city centers. However, to my surprise, both my ADMIXTURE results and my DAPC (discriminant analysis of principal components) results showed that pigeons in the Northeastern Megacity formed two genetic clusters: one cluster that contained samples from Boston and Providence, and another cluster that contained samples from the more southern cities (Figure 1 & 2).
However, Most Pigeons Are Not Moving Far
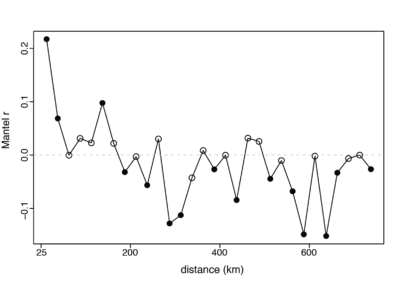
Further analysis revealed that most pigeons are not moving very far. Estimated Effective Migration Surfaces (EEMS) showed higher than expected migration within a city and lower than expected migration between cities (Figure 3). And a mantel correlogram showed that pigeons within 50km were highly related, but beyond that distance, they were no more likely to be related than by random chance (Figure 4). So why then, do we see only two genetic clusters? The rule of thumb among population geneticists is that it only takes one migrant per generation to maintain panmixia (random mating within a breeding population).

What Drives This Difference?
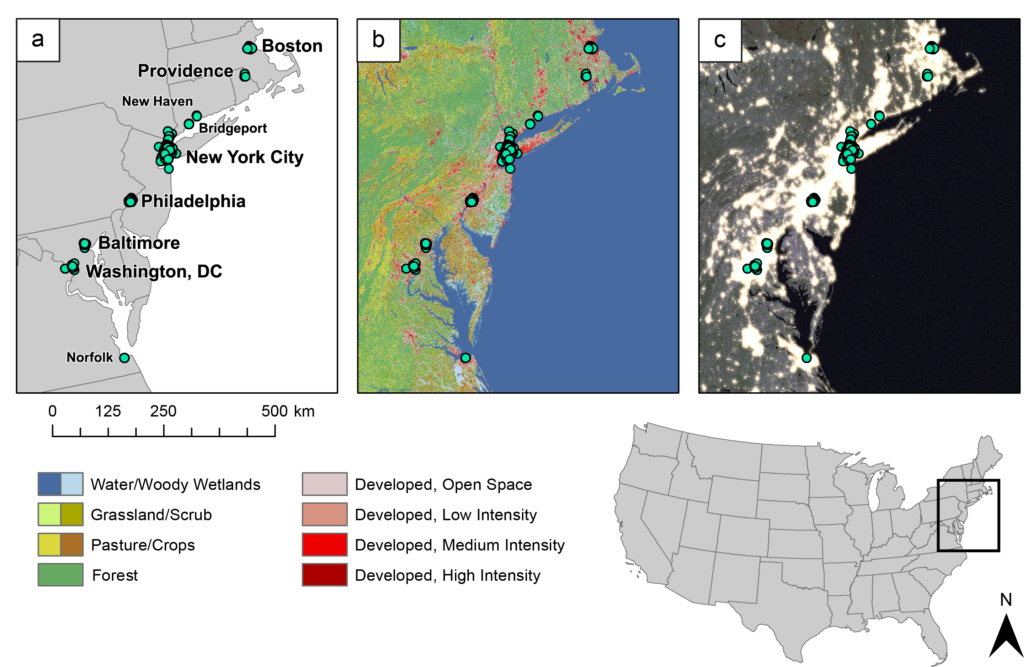
After exploring these data I began to think about the Northeast and the urbanization that occurs in this area. When looking at a map of impervious surface (a landscape feature often used by biologists to quantify the amount of urbanization) I noticed that each city appeared separate (see red areas in Figure 5b). But when I looked at the same sample area using NASA’s Light at Night I noticed that there was urbanization (in the form of artificial light at night) that was not being picked up by the impervious surface map (Figure 5c). I also noticed a break in light at night in Connecticut (between the Providence and New Haven samples). This got me thinking about how Connecticut is more suburban, with less densely packed housing, lots of green space, and fewer highrise buildings — the exact opposite of the landscape feature urban pigeons are drawn to. So maybe for pigeons, suburbanization limits dispersal. Of course, more research is needed to see how landscape features structure the pigeon population across the US — do we see the same breaks as we move West, North, and South? Do the Rocky Mountains act as a barrier? What about the Mississippi River? A lot more sample collection is needed to answer these questions but I can’t wait to find out!
Want to know more? Read the paper here:
Leave a Reply